 PPTF
PPTFWhich drawdown is passable: a metrics scale
Which drawdown is passable, which win rate is enough, which risk per trade is already dangerous — every metric has a zone from which a challenge is usually passed and a zone from which it cannot be passed by construction.
Scale
—
The boundaries of the zones are not standards but consequences of the limits
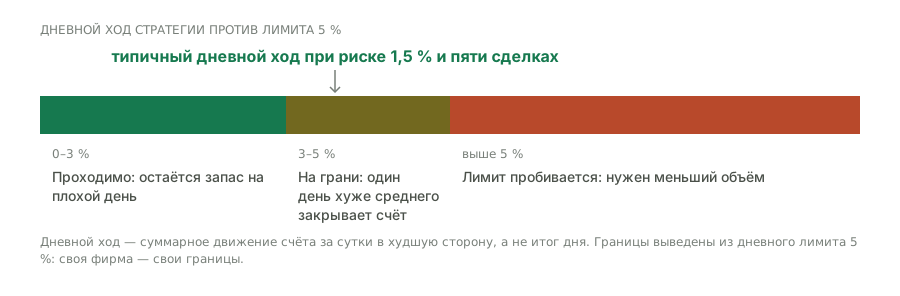
Not one of the boundaries above is taken from advice. Each follows from the arithmetic of typical limits: a daily 5% and a maximum 10%. Change the limits and the zones shift, so the scale should be read together with your own rules rather than instead of them.
Where the boundaries came from
- Drawdown of 8% and 10%
- The maximum limit is usually 10%. A historical drawdown equal to the limit means that failure is a matter of time rather than luck. Eight per cent is the limit minus room for slippage and an execution error.
- Risk per trade of 1.5%
- With a 5% daily limit, three trades in a row at 1.5% give 4.5% — almost the whole limit. Above that boundary the daily limit becomes the main cause of failure, which the pass model shows too.
- Average R = 1
- Below one, a positive expectancy requires a win rate above 50%, and that rarely holds over distance. It is not a prohibition but a requirement on the win rate.
- A streak of 8 stops
- At a win rate of around 45% a streak of that length is to be expected over the length of a stage. It sets the divisor for risk per trade: daily limit ÷ length of streak.
The metrics are linked, and that changes the conclusion
Looking at the metrics one at a time is pointless: a win rate of 40% is “bad” at R = 1 and perfectly workable at R = 2.5. The same goes for risk per trade — it can only be judged together with the worst streak. That is why the scale does not reduce the metrics to a single score: a points total would give a green verdict to an account that fails on one particular constraint.
The practical order: first the worst streak from your own history, from it the risk per trade, then win rate times R to check the edge, and only then drawdown — as a check that the first three were worked out correctly.
How to read the scale
The scale answers one question: does your value fall in the range at which the challenge limits are achievable. It is not an assessment of the quality of a strategy — a strategy with an 18% drawdown can be excellent for your own account and impassable for a challenge with a 10% limit.
- The green zone is not a goal but a condition
- Landing in it promises no pass: it means only that the limits will not stop you by construction. What decides after that is the edge.
- The red zone is not a verdict on the strategy
- It means incompatibility with typical limits at the current size. Reducing the size moves drawdown, risk and streak into the green zone — at the cost of speed.
- The boundaries move with the limits
- Every threshold is derived from a typical 5% a day and 10% overall. At a firm with limits of 4% and 8% the boundaries will be stricter, and they have to be recomputed from its numbers.
What the scale does not show
It looks at the metrics one at a time, while failure usually arrives from a combination of them — and that is its main limitation.
So the scale is a first step, not a conclusion. A value in the green zone on all five metrics means it is worth going on to work out size and probability; a red zone on even one means the size has to change before any calculations.
Frequently asked questions
Which drawdown counts as passable?
As a guide, a historical drawdown from your own statistics below 8% against a typical maximum limit of 10%. A drawdown equal to the limit means the account is lost not through bad luck but by construction: a smaller size is needed.
Why does the scale give no overall score?
Because additive scoring hands a green verdict to sets that cannot possibly pass: a weak R is offset by a good win rate and the total looks respectable, though a constraint has been broken. Every metric has a right of veto, and it has to be shown separately.
What if my metric falls into the yellow zone?
That is not a prohibition but an indication of which other metric to check. A yellow win rate calls for checking R, a yellow risk for checking the worst streak. There are two yellow zones in meaning: “too little” and “too much”.
Where did the boundaries of the zones come from?
From the arithmetic of typical limits: a daily 5% and a maximum 10%. The risk boundary of 1.5%, for instance, is the point past which three trades in a row eat almost the whole daily limit. Change the limits and the zones shift.
Why does a high win rate fall into the yellow zone?
Because over distance it is rare and more often means a short sample or hidden large losses — a strategy with no stop, say, where the winning trades are many and one loss equals ten wins.
Why is a high average R also a reason for caution?
Because it usually means the result rests on a few trades. For the consistency rule that is a direct problem: one large trade gives a day share above the cap, and the payout is trimmed.
Which drawdown counts as passable on futures programmes?
There the limits are often set in money and can be tighter in percentage terms, and trailing is more common. Convert the limit into a percentage of the account size and put it in — the zone boundaries shift, the logic stays.
Can a bad metric be offset by a good one?
Partly, and not always. A weak R is offset by a high win rate, because what matters is their product. But a historical drawdown above the limit is offset by nothing: it is a gate, not a score.
What if I have no metrics from my own history?
Build a history. The scale evaluates your numbers rather than replacing them: with no statistics it turns into a set of general guidelines you cannot decide a challenge purchase from.
In what order should the metrics be looked at?
First the worst losing streak — risk per trade follows from it. Then win rate times average R — that shows whether there is an edge at all. And only then the historical drawdown: it serves as a check that the first three were worked out correctly and agree with each other.
Read next
